Patterns of Social Vulnerability – An Interactive Dashboard to Explore Risks to Public Health on the US County Level
Description:
Social vulnerability is the susceptibility of a community to be adversely impacted by natural hazards and public health emergencies,
such as drought, earthquakes, flooding, virus outbreaks, and the like. Climate change is at the root of many recent natural
hazards while the COVID-19 pandemic is still an active threat. Social vulnerability also refers to resilience, or the ability to
recover from such adverse events. To gauge the many aspects of social vulnerability the US Center of Disease Control (CDC)
has subdivided social vulnerabilities into distinct themes, such as socioeconomic status, household composition, and others. Knowing
a community’s social vulnerabilities can help policymakers and responders to recognize risks to community health, prepare for
possible hazards, or recover from disasters. In this paper we study social vulnerabilities on the US county level and present research
that suggests that there are certain combinations, or patterns, of social vulnerability indicators into which US counties can be
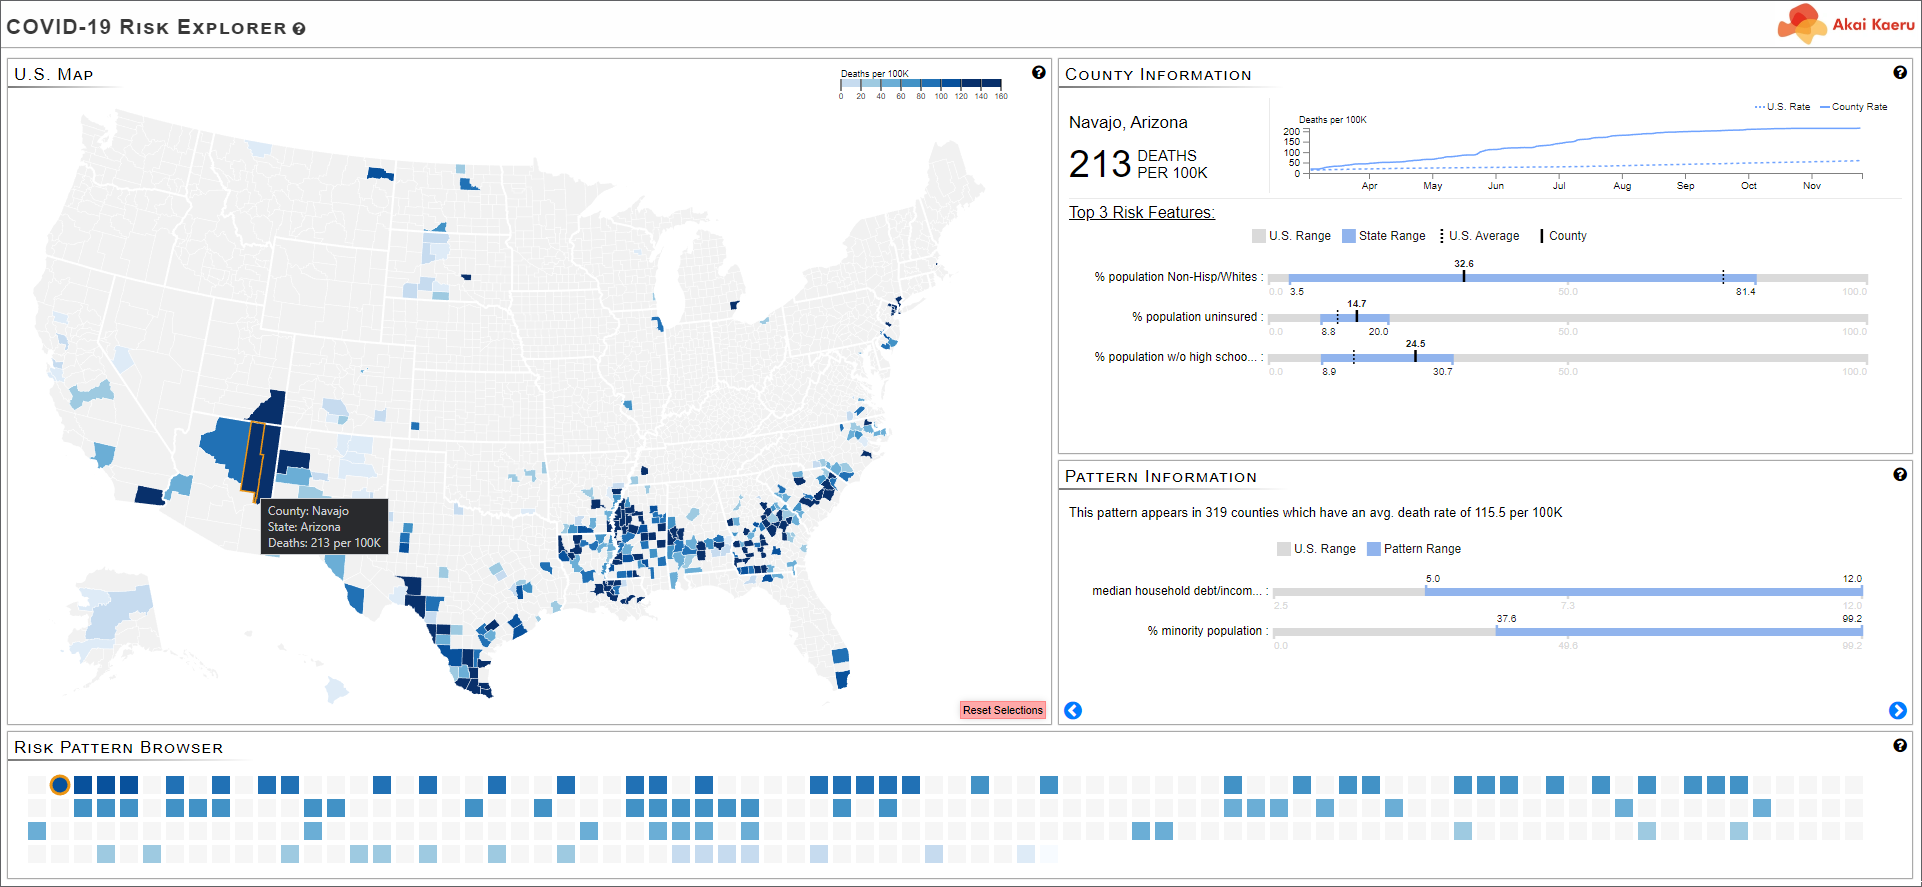
grouped. We then present an interactive dashboard that allows analysts to explore these patterns in various ways. We demonstrate
our methodology using COVID-19 death rate as the hazard and show that the patterns we identified have high predictive capabilities
of the pandemic’s local impact.
Note:
If you are looking to mine patterns use the techniques in this paper you can use data analytics software - the AK Analyst - developed by Akai Kaeru. The AK Analyst can be downloaded at this link.